PG&E / SCE / SDG&E Under NEM 3.0
What does solar actually save today?

Search interest around solar in California has surged again:
- “Is solar worth it after NEM 3.0?”
- “California solar payback period 2026”
- “PG&E solar savings calculator”
- “Solar vs no solar bill comparison”
This guide uses simplified but realistic assumptions based on current rate structures from California’s three major investor-owned utilities:
- Pacific Gas and Electric Company
- Southern California Edison
- San Diego Gas & Electric
1️⃣ What Changed Under NEM 3.0?
In 2023, the California Public Utilities Commission implemented Net Energy Metering 3.0 (NEM 3.0).
Key Change
Exported solar energy is no longer credited at full retail rates.
Instead:
- Export credits reflect “avoided cost” values.
- Midday export compensation often falls around $0.05–$0.08 per kWh.
- Under NEM 2.0, exports could offset near full retail rates (often $0.30–$0.40 per kWh).
This shift led many headlines to claim “solar is dead.”
But that conclusion ignores how solar works in 2026.
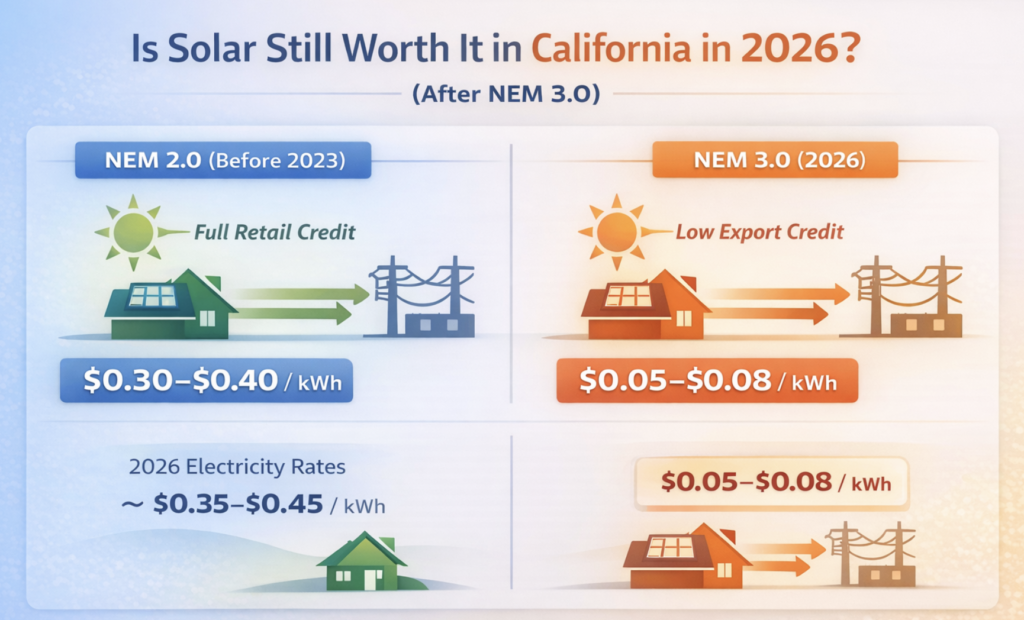
2️⃣ 2026 Retail Electricity Reality
California retail electricity remains expensive.
Typical 2026 Residential Effective Rates
| Utility | Typical Blended Rate (2026) |
|---|---|
| PG&E | ~$0.38–$0.45 / kWh |
| SCE | ~$0.32–$0.40 / kWh |
| SDG&E | ~$0.40–$0.47 / kWh |
Solar under NEM 3.0 performs best when:
- You consume your own production.
- You reduce high peak-period purchases.
- You integrate EV charging or battery storage.
Self-consumed solar still offsets the full retail rate.
3️⃣ Real Example: 600 kWh Home (PG&E Territory)
Assumptions
| Item | Value |
|---|---|
| Monthly usage | 600 kWh |
| Blended rate | $0.40/kWh |
| Bill without solar | $240 |
| Solar system | 6.5 kW |
| Avg monthly production | 750 kWh |
| Self-consumption | 70% |
| Export | 30% |
| Export credit | $0.07/kWh |
Without Solar
600 × 0.40 = $240
With Solar (NEM 3.0)
| Component | Calculation | Monthly Value |
|---|---|---|
| Self-used solar | 525 × 0.40 | $210 |
| Export credit | 225 × 0.07 | $15.75 |
| Total Solar Value | $225.75 |
Remaining grid bill ≈ $14
Solar doesn’t eliminate the bill entirely — but it dramatically reduces it.
4️⃣ Example With EV Charging
Now assume:
- Home usage: 600 kWh
- EV charging: +300 kWh
- Total usage: 900 kWh/month
Without Solar
900 × 0.40 = $360
With Same 750 kWh Solar System
Assume higher self-consumption (80%) due to smart charging.
| Component | Calculation | Monthly Value |
|---|---|---|
| Self-consumed | 600 × 0.40 | $240 |
| Exported | 150 × 0.07 | $10.50 |
| Total Solar Value | $250.50 |
New bill:
$360 − $250 ≈ $110
Solar significantly reduces EV charging costs — especially with off-peak scheduling.
5️⃣ Installation Cost & Payback
Assumptions
| Item | Value |
|---|---|
| System cost | $18,000 |
| Federal incentive | 30% |
| Net cost | ~$12,600 |
| Annual savings | $2,700–$3,000 |
| Simple payback | ~4–5 years |
Federal incentive reference:
Federal Solar Investment Tax Credit
California’s high retail rates continue to support competitive payback periods — even under NEM 3.0.
6️⃣ When Solar Makes Less Sense
Solar may be less compelling if:
- Monthly usage is below 400 kWh.
- Daytime occupancy is low.
- Roof shading is significant.
- You plan to move within 3–4 years.
NEM 3.0 favors:
- Higher consumption homes.
- EV owners.
- Time-of-use optimization.
7️⃣ Solar + Battery: The Optimization Layer
Home battery systems such as:
- Tesla Powerwall
allow homeowners to:
- Store excess midday solar.
- Discharge during 4–9 PM peak windows.
- Avoid exporting at low credit rates.
- Improve effective ROI under NEM 3.0.
Under the new structure, batteries often restore strong solar economics.
8️⃣ 2026 Bottom Line
Back in 2016–2019, solar economics were driven by generous net metering credits.
In 2026, economics are driven by:
- High retail electricity prices
- Self-consumption
- EV integration
- Time-of-use optimization
- Storage arbitrage
Solar is no longer a “sell to the grid” strategy.
It is an “avoid buying expensive peak power” strategy.
For many customers of PG&E, SCE, and SDG&E — especially EV owners — solar still produces meaningful savings.
But:
- System sizing matters.
- Usage timing matters.
- Battery integration matters.
Quick Comparison Table: 2026 Solar Reality
| Scenario | Without Solar | With Solar | With Solar + Battery |
|---|---|---|---|
| 600 kWh home | $240 | ~$14 | ~$5–$10 |
| 900 kWh + EV | $360 | ~$110 | ~$60–$80 |
| Export value | — | Low ($0.05–$0.08) | Minimized |
| Payback | — | 4–5 yrs typical | 5–7 yrs typical |